| 61.11. Automation log | ||
|---|---|---|
 | Chapter 61. Administration |  |
This section allows reading current lines state of Digital Input/Output and analog values of Analog Input. All Input/Output transitions are called IOLOG events and they are viewable as graphs.
Two kinds of graphs will be possible:
Real Time;
Historical.
Click on Automation log to access to the following page:

Select one or more I/O line and the time window in minutes and click GO! button.

Will be shown a graph, as in example below:

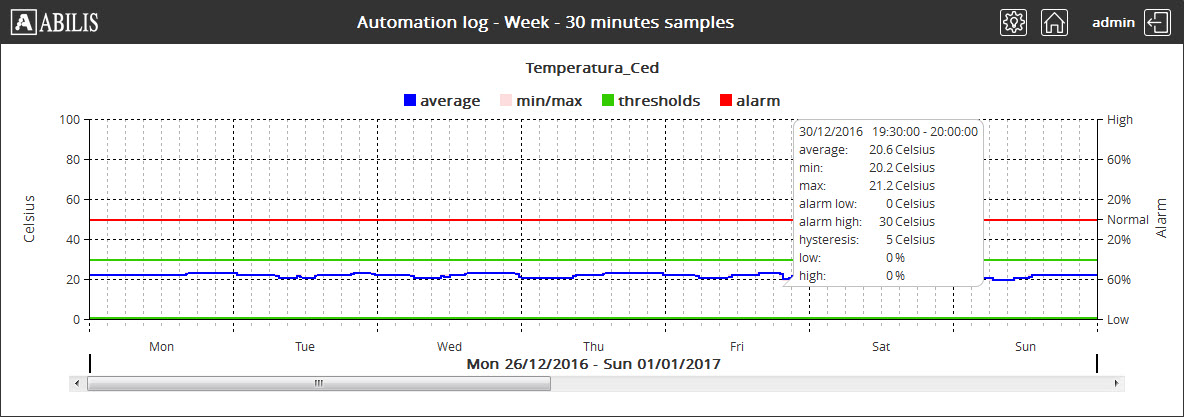
This example is for digital I/O. For analog inputs, graphs will be different, because they include also other variables as:
average - current average of analog input.
min/max - the minimum and maximum values that have been reached during the sample interval.
thresholds - alarm low and high threshold;
alarm - percentage of low and high alarm.
Example of analog input:

To view the detailed info, click on the graph.

Click on Automation log to access to the following page:

Select one or more I/O line and the tab with selected period and click GO! button.

Will be shown a graph, as in example below:

To view the detailed info, click on the graph, there:
digital - variable represents an average digital value 0 .. 100%;
transitions - variable represents number of transitions. The value is obtained by counting how many transitions, either OFF to ON or OFF to ON, are present in the sample interval.

Digital average sounds strange, that's clear, it's a way we found to synthesize the situation where the I/O is not completely ON or OFF in the sample interval and can be described in this way:
the Y axis has value 0 to represent OFF and value 100 (100%) to represent ON, and intermediate values to represent the percentage of the sample interval where state was ON.
In case of multiple transitions the percentage of ON state is summed.
in absence of transitions, and therefore the state is not changed during the sample interval, the percentage is either 0 or 100.
Example of analog input when selected period is one week:
