| 43.3. Example of TRFA configuration | ||
|---|---|---|
 | Chapter 43. TRFA - Traffic Analyzer |  |
| 43.3. Example of TRFA configuration | ||
|---|---|---|
| | Chapter 43. TRFA - Traffic Analyzer | |
Specifications:
Activate the statistic survey of the LAN interface (ip-1) and the internet connection (ip-2).
Activate the TOTALS survey on the LAN
resource, .
Activate the IP-PROT survey (gathers the
traffic dividing it by protocol for every source IP address) on the
Internet connection resource.
Activate the TRFA survey on the private LAN (IP-1 resource).
[11:13:18] ABILIS_CPX:s p ip-1 trfa:yesCOMMAND EXECUTED [11:13:20] ABILIS_CPX:d p ip-1RES:Ip-1 - IP over LAN (LAN) -------------------------------------------------- Run DESCR:LAN OPSTATE:UP LOG:NO STATE-DETECT:NORMAL LANRES:Eth-1 IPADD:192.168.029.254 MASK:255.255.255.000 REDIS:EXT HIDE:NO RP:NONE IPSEC:NO VRRP:NO NAT:INSIDE UPNP:NO DIFFSERV:NO DDNS:NO OUTBUF:100 OUTQUEUE:FAIR MTU:1500 BRD:NET OUTSPL:NO INBUF:0 mru:1500 SRCV:NO - TRFA section --------------------------------------------------------- TRFA:YES TRFA-MODE:TOTALS - Lan ------------------------------------------------------------------ LLOG:NO arpcache:200 CACHETIMER:120 rxbuf:4 txbuf:14 VLAN-ID:UNTAG RES:Eth-1 --------------------------------------------------------------------- Run DESCR: LOG:DS MODE:AUTO DUPLEX:HALF dma-rxbuf:250 dma-txbuf:25 max-vlans:0 ip-rxbuf:25 arp-rxbuf:5 pppoed-rxbuf:5 pppoes-rxbuf:25
Activate the TRFA survey on the Internet connection (ip-2 resource) and configure it with following the specifications.
[11:20:18] ABILIS_CPX:s p ip-2 trfa:yesCOMMAND EXECUTED [11:21:02] ABILIS_CPX:s p ip-2 trfa:yes trfa-mode:ip-prot trfa-side:remote trfa-ipadd:*COMMAND EXECUTED [11:46:03] ABILIS_CPX:d p ip-2RES:Ip-2 - IP over LAN (LAN) -------------------------------------------------- Run DESCR:WAN OPSTATE:UP LOG:NO STATE-DETECT:NORMAL LANRES:Eth-2 IPADD:192.168.010.254 MASK:255.255.255.000 REDIS:EXT HIDE:NO RP:NONE IPSEC:NO VRRP:NO NAT:OUTSIDE UPNP:NO DIFFSERV:NO DDNS:NO OUTBUF:100 OUTQUEUE:FAIR MTU:1500 BRD:NET OUTSPL:NO INBUF:0 mru:1500 SRCV:NO - TRFA section --------------------------------------------------------- TRFA:YES TRFA-MODE:IP-PROT IP-RESERVE:AUTO TRFA-SIDE:REMOTE TRFA-IPADD:* - Lan ------------------------------------------------------------------ LLOG:NO arpcache:200 CACHETIMER:120 rxbuf:4 txbuf:14 VLAN-ID:UNTAG RES:Eth-2 --------------------------------------------------------------------- Run DESCR: LOG:DS MODE:AUTO DUPLEX:HALF dma-rxbuf:250 dma-txbuf:25 max-vlans:0 ip-rxbuf:25 arp-rxbuf:5 pppoed-rxbuf:5 pppoes-rxbuf:25
![[Tip]](../images/tip.png) | Tip |
|---|---|
Interesting chapters: Section 20.3, “IP Resources”. |
Add the user “trfa” and enable it to HTTP.
[11:01:39] ABILIS_CPX:a user:trfa pwd:trfa http:yesCOMMAND EXECUTED [11:01:39] ABILIS_CPX:d user------------------------+-------------+---------------------------------------- USER PWD ACT|CTIP CLUS |CHAT LDAP PPP FTP HTTP MAIL IAX SIP VO ------------------------+-------------+---------------------------------------- admin *** YES # # YES YES YES YES YES NO NO NO NO guest NO # # NO NO NO NO NO NO NO NO NO trfa *** YES # # NO NO NO NO YES NO NO NO NO
Add the HTTP rights for the user “trfa”.
[11:01:39] ABILIS_CPX:a http rights path:/sys/trfa/ user:trfaCOMMAND EXECUTED [11:01:39] ABILIS_CPX:d http rights------------------------------------------------------------------------------- ID: PATH: USER: FILE: DIR: RECUR: PROT: ------------------------------------------------------------------------------- 1 /sys/ admin r--- l--- YES PLAIN,SSL ------------------------------------------------------------------------------- 2 /sys/pub/ anonymous r--- ---- YES PLAIN,SSL ------------------------------------------------------------------------------- 3 /sys/trfa/ trfa r--- l--- YES PLAIN,SSL -------------------------------------------------------------------------------
| Tip |
|---|---|
Interesting chapters: |
The TRFA resource allows to save and analyze the traffic for one or more IP interfaces.
Follow the steps described in Chapter 61, IP traffic analyzer.
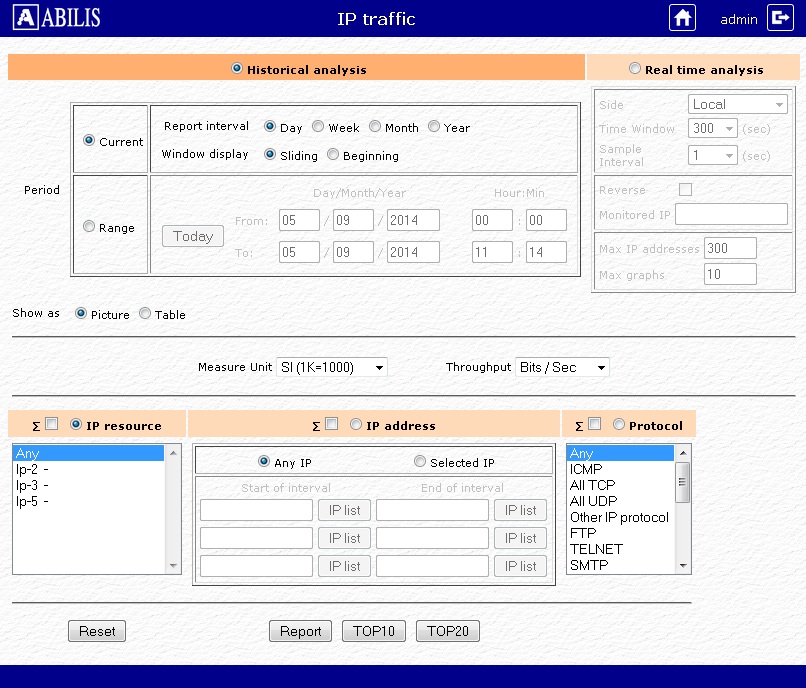
The TRFA starting page will be shown.
Definition of the configurable parameters:
PeriodIt allows the definition of the time period that will be used as a report base.
Current year
If you select the current year, you can define the report period more precisely:
Year: the minimal period is one day.
Month: the minimal period is two hours.
Week: the minimal period is 30 minutes (half an hour).
Day: the minimal period is five minutes.
Range: You can choose the range that will be used as a report base.
Window displayA window where you can choose the time period: day/week/month/year.
Sliding: views the whole period preceding the current time and date. For instance: if you select the “day” period and the current time is 10.PM, you will get a report of the last 24 hours: until 10PM of the preceding day.
Beginning: views the period starting from the beginning of the current day: For instance, it is 9.PM, and you select the “day” period you will view the report starting at 0.AM and ending at 9.PM.
Show asIt detects an output view of the report.
Picture: in this case traffic information will be represented as a picture.
Table: in this case the traffic information will be represented as a table.
![[Note]](../images/note.png) | Note |
|---|---|
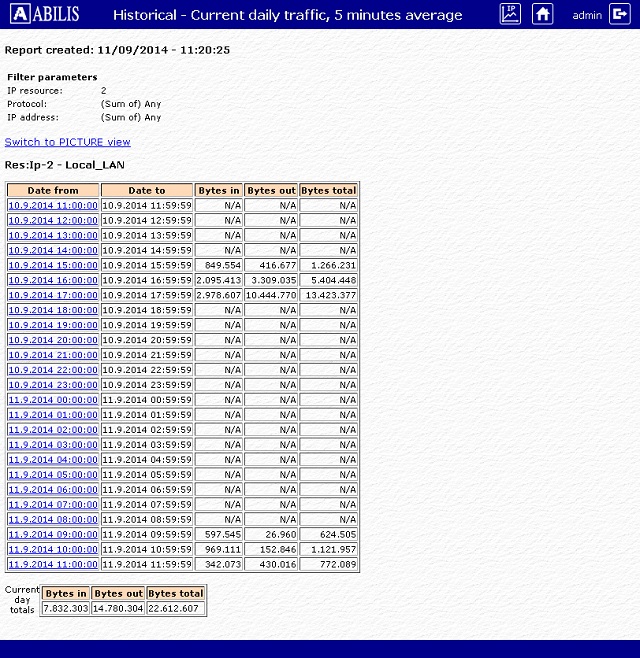
You can always switch to another view: graph/table and vice versa. To switch from graph to table, click on the graph; to switch from table to graph, click on Switch to PICTURE view. |
∑If is selected the traffic information will be represented in a unique graph.
Measure UnitsDefines the kilobytes size that will be used for the report. You can use, if you prefer, a value equal to 1000 bytes as 1024 bytes.
ThroughputThis parameter defines the unit that will be used to show the traffic information. You can select: bits per second (Bits/Sec) or bytes per second (Bytes/Sec).
IP ResourceFilters the traffic information for a selected period by IP resource only.
IP AddressFilters the traffic information for a selected period by selected IP addresses (or IP addresses intervals) only.
ProtocolsFilters the traffic information for a selected period by selected protocols only.
ReportThis button generates the graphs or the table.
ResetRestores the default settings.
TOP 10 IPShows the ten IP addresses that have generated the most traffic on an IP resource and the amount of traffic. It simultaneously generates IN, OUT, IN+OUT traffic.
TOP 20 IPShows the twenty IP addresses that have generated the most traffic on an IP resource and the amount of traffic. It simultaneously generates IN, OUT, IN+OUT traffic.
Real time analalysisIt displays the analysis in real time.
Side: Side for the analysis.
LOCAL = IP addresses of the
network attached to the selected IP resource.
REMOTE = IP addresses on the
other Abilis IP resources that generated or received the
traffic on the selected IP resource
Time window: The amount of time to consider to get an average result
Sample interval: Sampling interval
Reverse: Track peers of the IP address specified in Monitored IP
Monitored IP: IP address for which peers are tracked
Max IP addresses: Maximum number of IPs displayed
Max graphs: Maximum number of graphs displayed
Below there are examples of IP Traffic Analyzer consultations through HTTP interface.
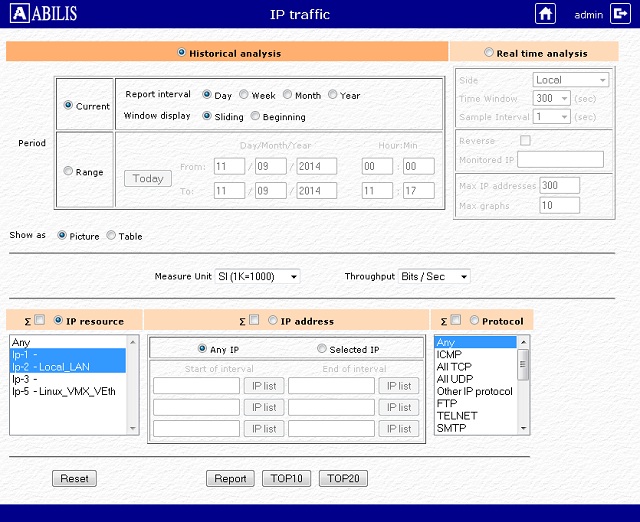
Example of view: IP-1 and IP-2 resources day graphs.
In Period click day option.
Select IP-1 and IP-2 in the IP resource list. (click on IP-1 and keep the Ctrl button pressed while clicking on IP-2).
Keep the other default settings: Window display Sliding, Display information as Picture, Report type Individuals:
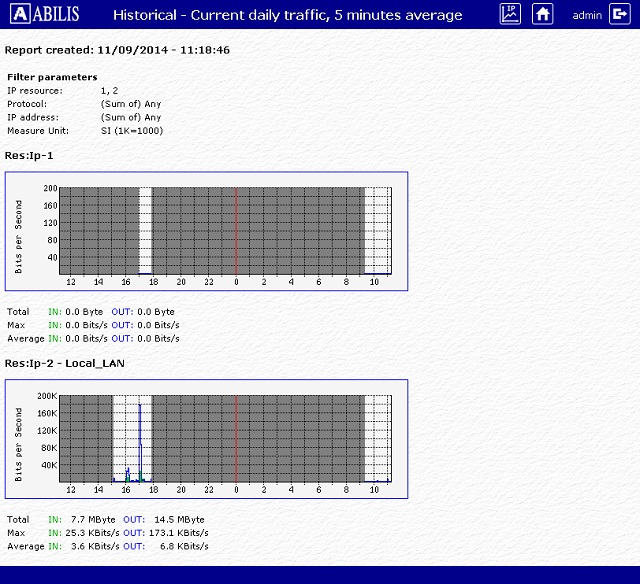
To view the graphs click on the button.
| Note |
|---|---|
The graph is grey in the period in which the TRFA was not activated. |
To view the tables click on the graph.
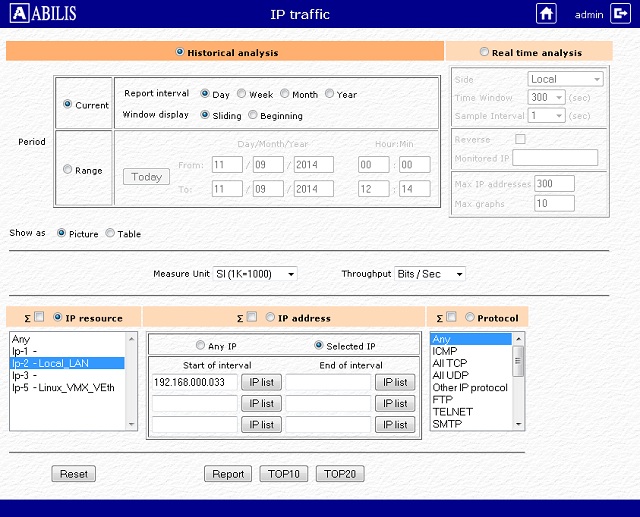
View example: IP-2 resource day graph generated by the IP 192.168.0.33.
In Period select Day option.
Select IP-2 in the IP resource list.
Select Selected IP in the IP address filter.
Type the IP address 192.168.0.33 in the label.
Keep the other default settings: Window display Sliding, Display information as Picture, Report type Individuals.
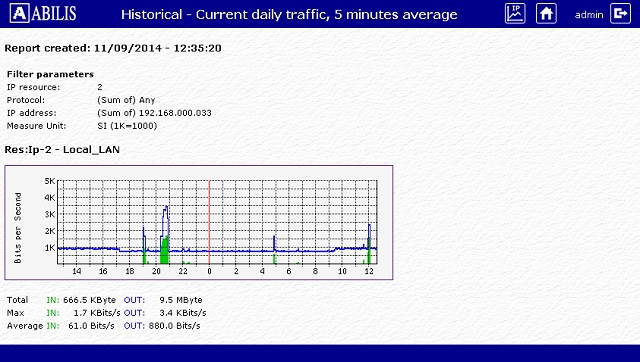
To view the graph, click on the button.
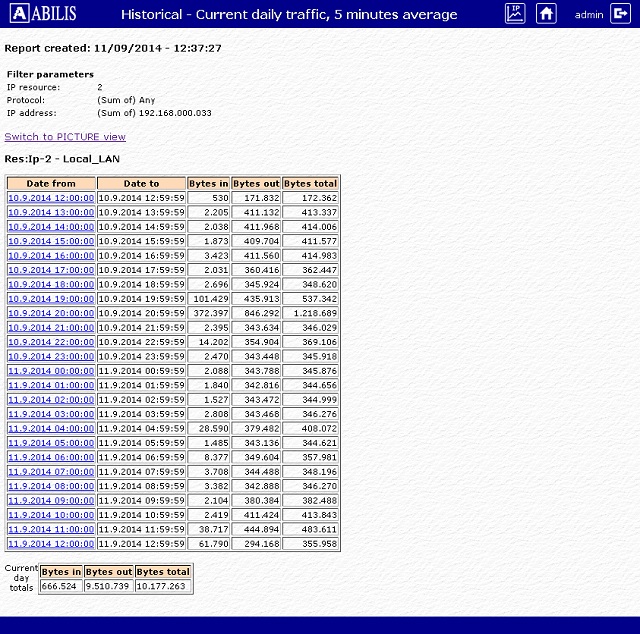
To view the table click on the graph.
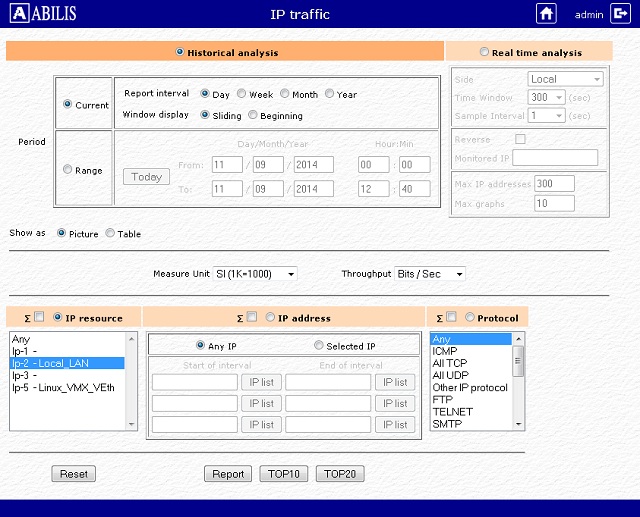
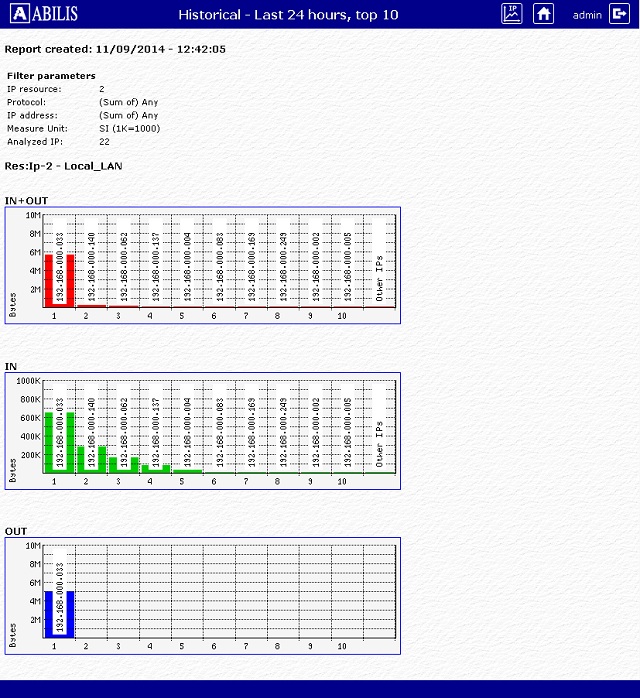
Let’s try to view: the 10 IP addresses that have generated the most traffic on the IP-2 resource, and quantify that traffic:
In Period select Day option.
Select IP-2 in the IP-resource list.
Keep the other default settings: Window display Sliding, Display information as Picture, Report type Individuals.
To view the graph click on the button.
| Note |
|---|---|
You can get this view only if you select one IP resource from the IP resource list at a time. |
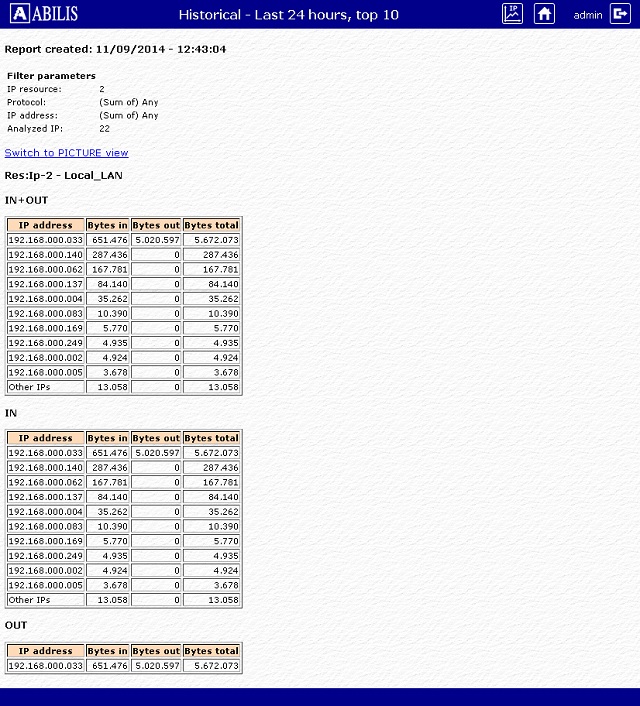
To view the table and the whole traffic total of the single IP click on the graph.
![[Caution]](../images/caution.png) | Caution |
|---|---|
To make this view work, you must configure the TRFA on
the IP resource in
|
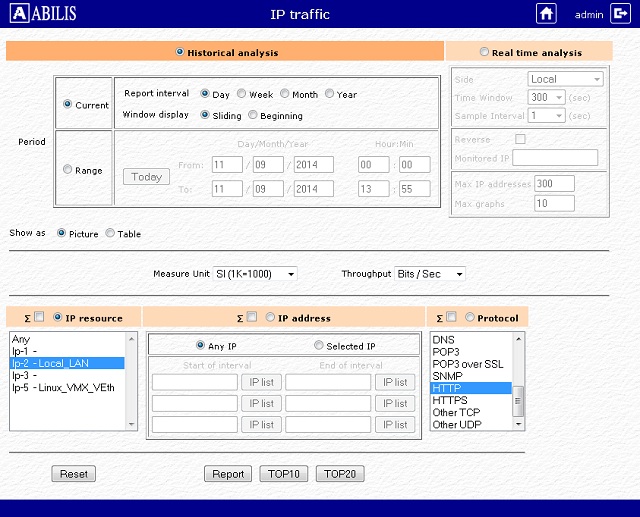
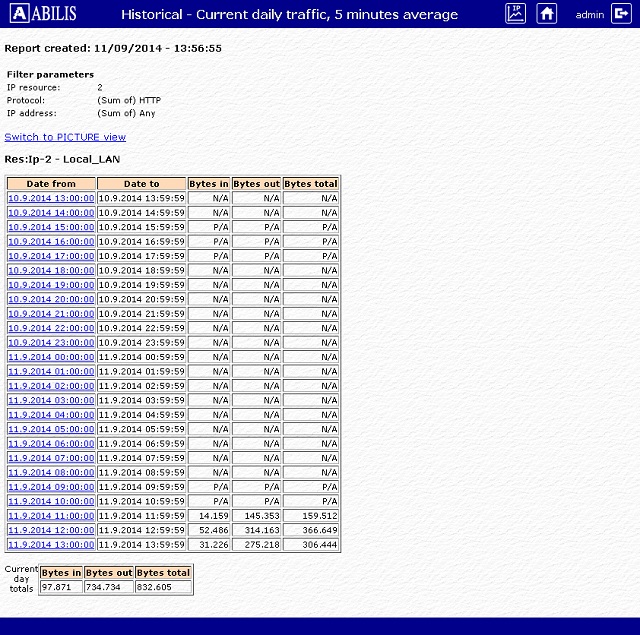
To view the day traffic of HTTP conveyed through the IP-1 resource follow these instructions:
In Period select Day option.
Select IP-2 in the IP-resource list.
Select HTTP in the Protocols list.
Keep the other default settings: Window display Sliding, Display information as Picture, Report type Individuals.
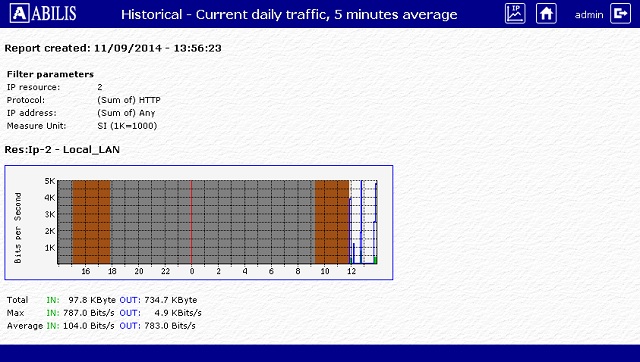
To view the graph click on the button.
To get the table view, click on the graph.
| Caution |
|---|---|
To make this view work, you must configure the TRFA on
the IP resource in
|
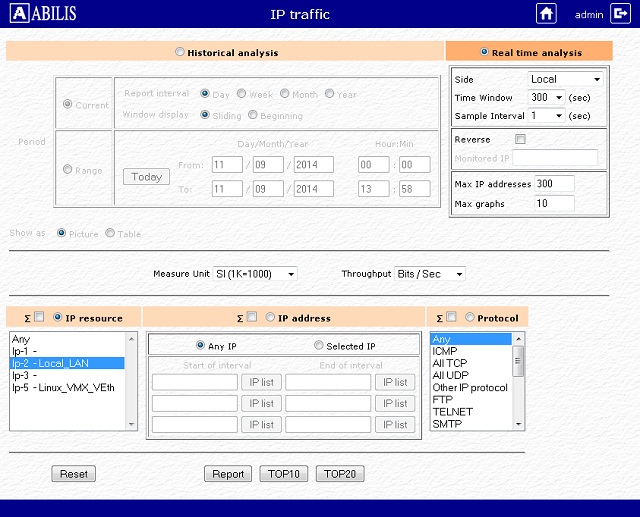
To view the network traffic in real time use the Real time analisys.
Example: view who is generating more traffic on Ip-2 and where the data are sent.
Select Real time analysis.
Select Ip-2 resource
Keep the other default settings: Window display Sliding, Display information as Picture, Report type Individuals.
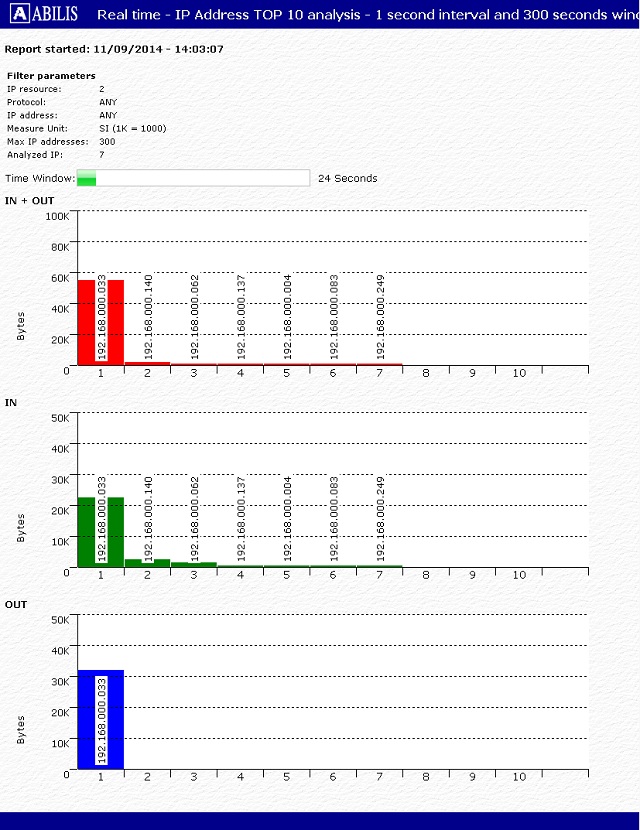
Click the TOP10 button.
We see that 192.168.0.33 is generating
more traffic than the other devices.
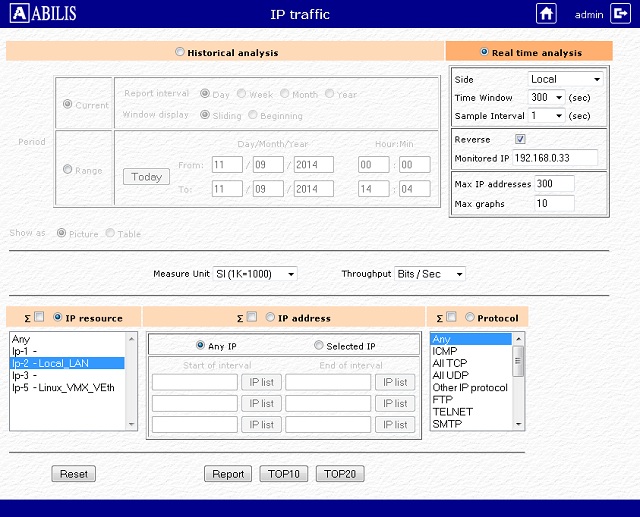
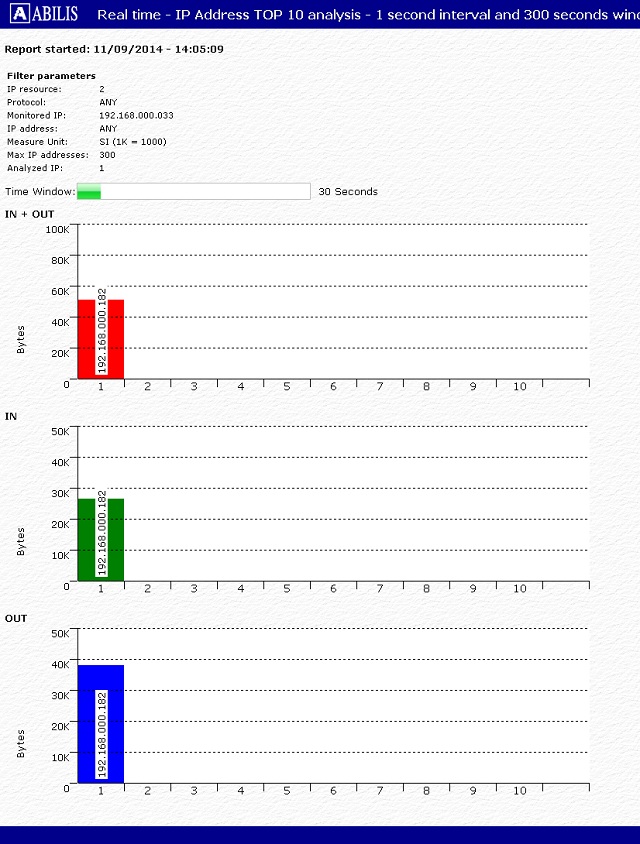
Select Reverse to see where the data are going to
Insert 192.168.0.33 in Monitored IP textbox
Click on TOP10 to see the IP where data is flowing
We see that 192.168.0.33 is sending/receiving data from 192.168.0.182.
| |  | |
| 43.2. TRFA diagnostics, statistics and debug |  | Chapter 44. LDAP - Lightweight Directory Access Protocol |