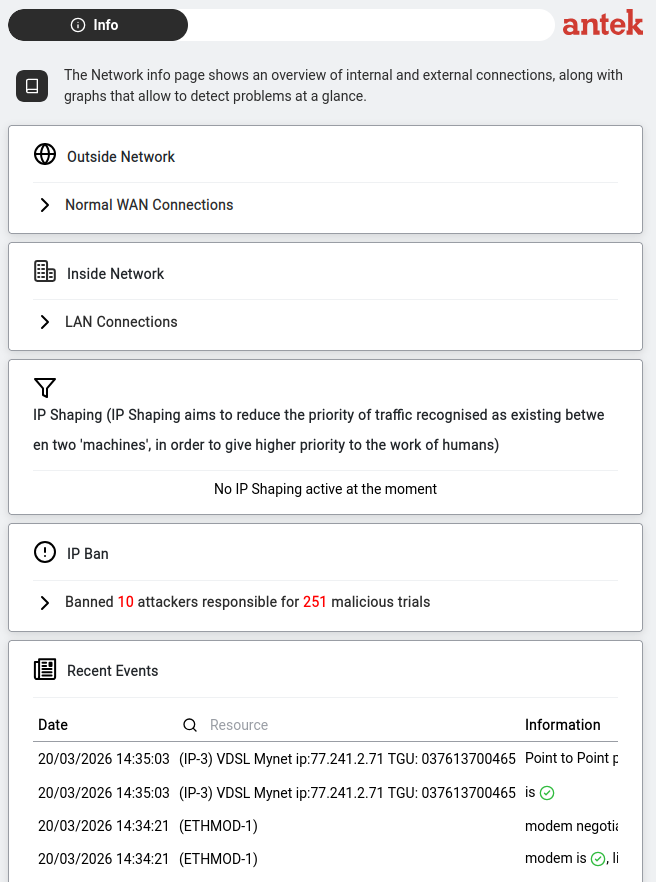
The Info tab is the live monitoring dashboard for the Networking section — connection status, bandwidth graphs, VPN and WAN-bundle quality, IP Shaping diagnostics, the IP Ban table and recent network events. It is read-only; everything you see here is configured on the Settings tab.
The Info tab is divided into four sections, each in its own card. Let's walk through each one.
This section shows your LAN Connections. Click the expand arrow (▸) to open it. Three sub-tabs appear: Overview, ARP Monitor and SNMP Monitor.
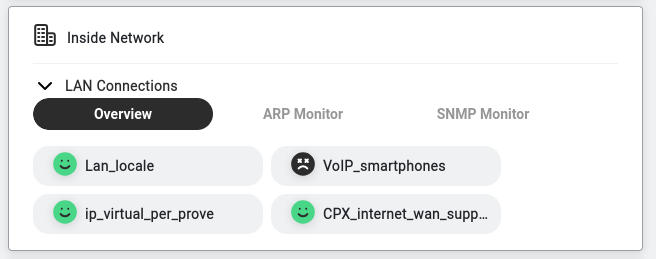
Each connection appears as a pill-shaped button with a status indicator:
Click on a connection to see its bandwidth statistics: Line Load (current and historical) and Top 5 (which devices/services use the most bandwidth). On a multi-path resource (AIPT2 tunnel or WAN bundle), the Select Paths dropdown next to the resource selector lets you overlay several paths on the same Line Load graph to compare them — see View traffic analysis.
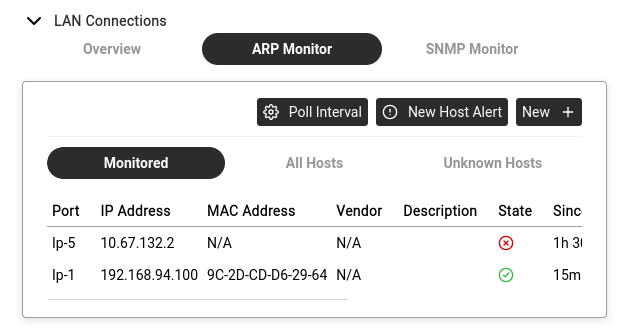
Monitors devices on your network using ARP (Address Resolution Protocol — how devices discover each other on a local network). The ARP Monitor has three sub-tabs:
| Sub-tab | What It Shows |
|---|---|
| Monitored | Devices you have chosen to watch (with status, history and editable entries). Columns are documented below. |
| All Hosts | Every device the Abilis has seen on the network — whether you're monitoring it or not. |
| Unknown Hosts | Devices that appeared on the network but are not in your monitored list. Each unknown host has an Add To Monitor button so you can start watching it. |
Columns on the Monitored sub-tab:
| Column | What It Shows |
|---|---|
| Port | The Abilis interface (e.g. Ip-1) where this device was last seen. |
| IP Address | The device's current IP. |
| MAC Address | The device's hardware address — the unique 48-bit identifier burned into its network card. |
| Vendor | Manufacturer name, derived from the first three bytes of the MAC (the OUI prefix) looked up against the public IEEE vendor list. Blank or "Unknown" if the prefix isn't registered. |
| Description | Free-text label you set yourself. |
| State | ✓ = device is responding to ARP probes (up). ✗ = no response (down). |
| Since | How long the device has been in its current state. |
| Max down | Tolerance window in seconds — how long the device may go silent before its State flips to ✗. |
Three buttons at the top right:
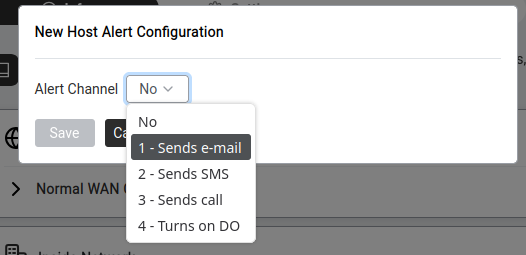
The Alert Channel dropdown offers five options:
| Option | What Happens |
|---|---|
| No | Alerts disabled. |
| 1 - Sends e-mail | An email notification is sent to the configured address. |
| 2 - Sends SMS | An SMS is sent (requires GSM/LTE hardware). |
| 3 - Sends call | An automated phone call is made. |
| 4 - Turns on DO | Activates a digital output configured via Automation hardware — e.g. flashes an LED, triggers a relay or fires an external alarm. |
Click Save to apply, or Cancel to close without saving.
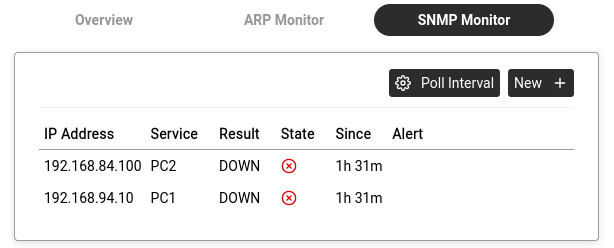
Monitors services on network devices using SNMP (Simple Network Management Protocol). Each entry shows:
Same Poll Interval and New + buttons as ARP Monitor.
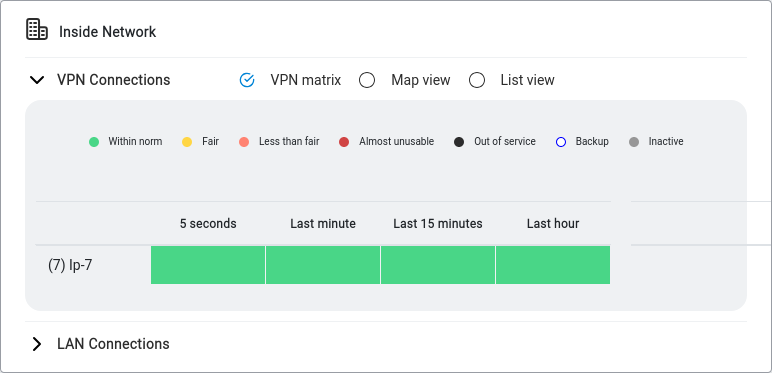
If your Abilis has VPN tunnels configured (connecting to other Abilis units or remote offices — see Networking How-To → Set up a VPN tunnel), this section shows their status in real time. Click the expand arrow (▸) next to VPN Connections to open it.
Three view modes are available:
| View | What It Shows |
|---|---|
| VPN matrix | Colour-coded bars showing connection quality over time (5 seconds, last minute, last 15 minutes, last hour). This is the default and most useful view. |
| Map view | Geographic view of tunnel endpoints (if coordinates are configured). |
| List view | Simple text list of all tunnels with their status. |
The colour legend for the VPN matrix:
| Colour | Meaning |
|---|---|
| Within norm — tunnel is working well | |
| Fair — minor quality reduction | |
| Less than fair — noticeable quality issues | |
| Almost unusable — serious problems | |
| Out of service — tunnel is down | |
| Backup — backup tunnel (standby) | |
| Inactive — tunnel is configured but not running |
Below the Inside Network panel, the Outside Network section shows the status of your WAN (internet-facing) connections — how the Abilis reaches the outside world.
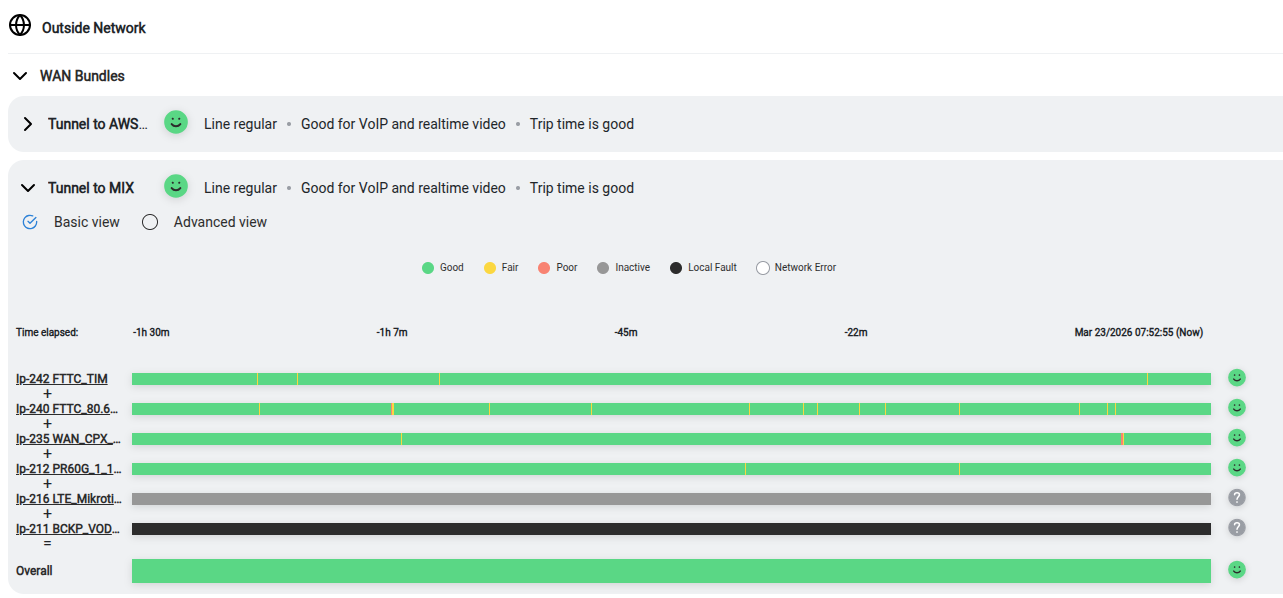
A WAN Bundle groups up to six upstream transports — internet lines (DSL, fibre, LTE) and/or VPN tunnels that ride on top of them — into one logical link. The Abilis spreads traffic across them for extra bandwidth and fails over automatically when one degrades; underneath, this is its AIPT2 tunnel technology.
Each bundle row (e.g. "Tunnel to AWS…", "Tunnel to MIX") shows:
Click the expand arrow (▸) on a bundle to open its detail panel, then switch between two levels of detail with the Basic view / Advanced view toggle:
| View | What It Shows |
|---|---|
| Basic view | One quality bar per line — a quick Good/Fair/Poor read of each line across time. Best for spotting when and where a problem struck. |
| Advanced view | The full diagnostic: each line split into Upload and Download, every column coloured by which impairment is biting, plus per-direction bandwidth figures and the editable preferred treatment type. |
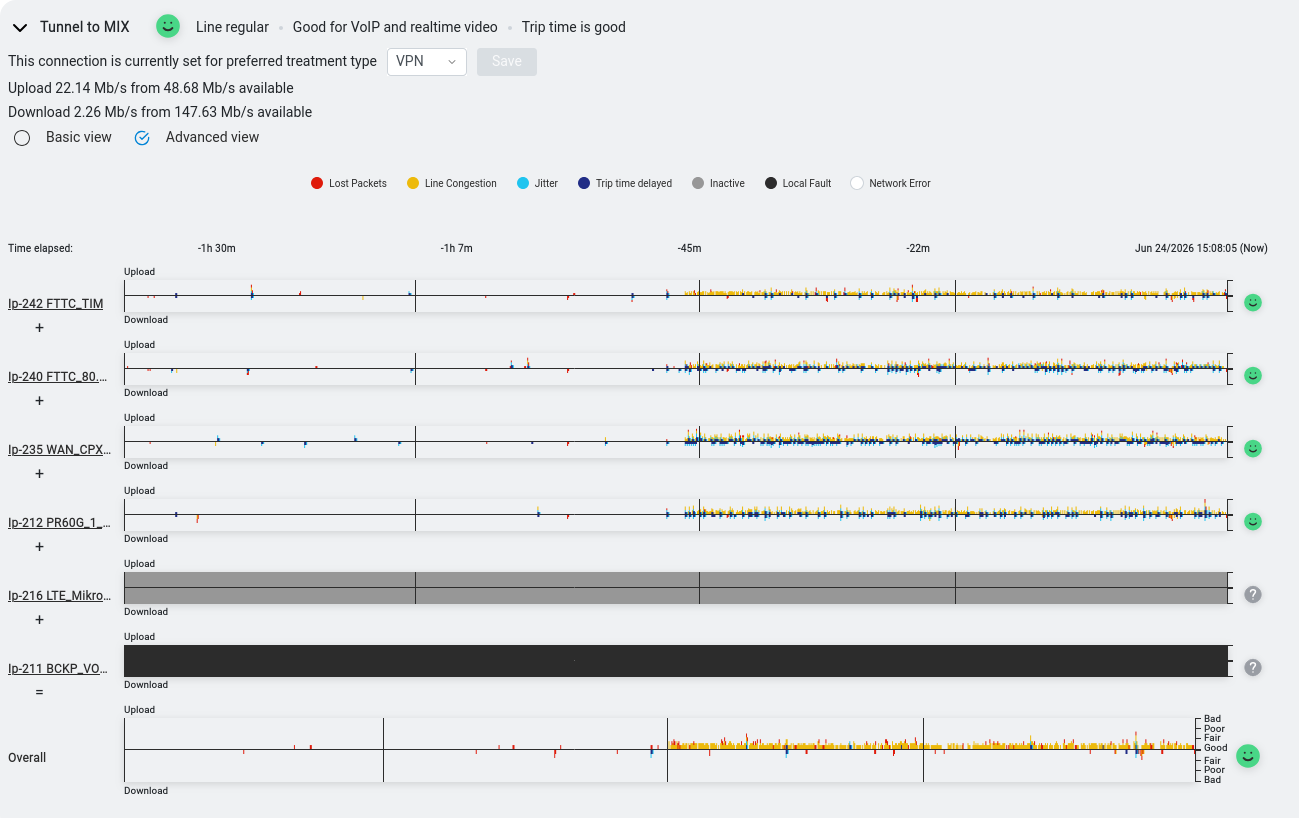
Reading the timeline. Each line gets its own strip, split into an Upload half (above the centre line) and a Download half (below it). Time runs left to right — from about ninety minutes ago on the left to Now on the right. Every coloured column is one measurement: its colour tells you which problem occurred and its height tells you how bad it was at that instant. The centre line is the healthy baseline; the taller a column grows away from it, the worse the quality at that moment — the same scale the Overall strip prints along its edge (Good in the middle, then Fair, Poor and Bad toward the top and bottom). A healthy line hugs the centre as a thin flat trace; a struggling line sprouts tall coloured spikes. Because Upload and Download are drawn separately, you can tell at a glance whether a problem is hitting one direction or both.
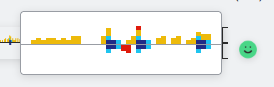
The colour legend has two kinds of entry. The first four are impairments — coloured spikes on a line that is still working, each naming the problem that hit at that moment:
| Colour | Meaning |
|---|---|
| Lost Packets — packets that never arrived and had to be resent | |
| Line Congestion — the line is running close to its bandwidth limit | |
| Jitter — uneven gaps between arriving packets | |
| Trip time delayed — the round trip is taking longer than usual |
The last three are whole-line states — a solid band that fills the strip when a line stops carrying normal traffic, rather than a per-moment spike:
| Colour | Meaning |
|---|---|
| Inactive — configured but not in use, like a standby backup | |
| Local Fault — the line is down because of a fault on your side of the link | |
| Network Error — the line is down because of a fault further out in the provider's network |
By default a bundle simply balances the load. The preferred treatment type dropdown lets you single out one kind of traffic and route it, line by line, onto whichever line scores best on the metric that matters most to it. Pick a type and click Save. Hovering an option pops up Abilis's own one-line explanation of what it optimises — the same logic the table below spells out.
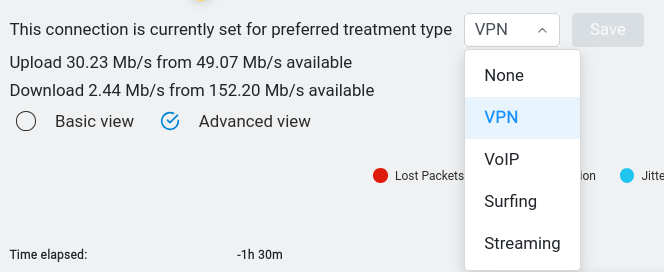
| Type | Best for | How it picks a line |
|---|---|---|
| None | everything (default) | No preference — spreads traffic evenly to balance the load across all lines. |
| VoIP | phone calls | The line with the fewest lost packets, least jitter and lowest delay — and it sends a backup copy on the second-best line, so one dropout can't break the call. Weighs lost packets 40%, jitter 33%, trip time 27%. |
| VPN | interactive work — remote desktop, video calls, online games | The most responsive line: delay first, then spare bandwidth, then jitter and loss. Weighs trip time 33%, throughput 28%, jitter 22%, lost packets 17%. |
| Streaming | video | The line with the most spare bandwidth, so the picture holds its bitrate; delay and jitter are ignored because the player buffers. Weighs throughput 67%, lost packets 33%. |
| Surfing | web browsing, email and downloads | The most reliable line (fewest lost packets), so pages and files don't stall on resends; delay and jitter are ignored. Weighs lost packets 62%, throughput 38%. |
The Overall row at the bottom blends every line into the bundle's combined health and is
the one strip that prints the quality scale on its edge — Good at the centre, then
Fair, Poor and Bad toward the top and bottom. The lines above
carry their own resource names (e.g. Ip-242 FTTC_TIM, Ip-240 FTTC_80…) with a "+"
icon you can click for per-line details.
When no traffic is currently being shaped, you will see: "No IP Shaping active at the moment".
When traffic IS being shaped, a Diagnostics section appears showing which connections are being throttled, with real-time graphs comparing actual usage to the allowed limits.
The Abilis automatically blocks IP addresses that make too many failed login attempts (brute-force protection). The banner reads: "Banned 0 attackers responsible for 0 malicious trials" (the numbers update in real time).
Click the expand arrow (▸) to see the ban list and the Unban Addresses button. Click Preferences to configure the banning behaviour:
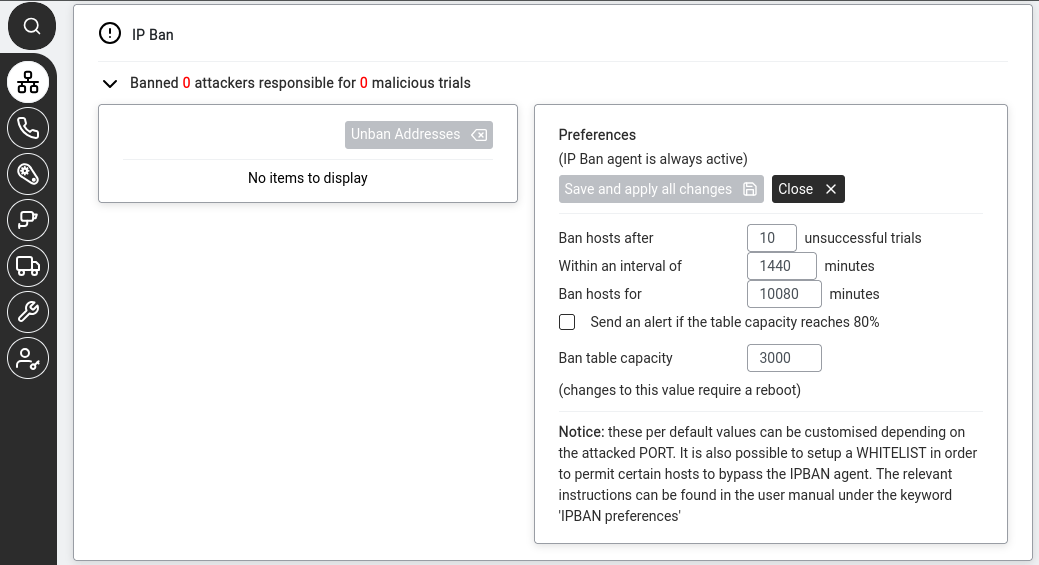
The Preferences panel shows:
| Setting | Default | What It Controls |
|---|---|---|
| Ban hosts after | 10 unsuccessful trials | How many failed login attempts trigger a ban. |
| Within an interval of | 1440 minutes (24 hours) | The time window in which those attempts must occur. |
| Ban hosts for | 10080 minutes (7 days) | How long the ban lasts. |
| Send an alert if the table capacity reaches 80% | ☐ (off) | Warns you if the ban list is getting full. |
| Ban table capacity | 3000 | Maximum number of banned IPs. |
IPBAN preferences.
Click Save and apply all changes or Close.
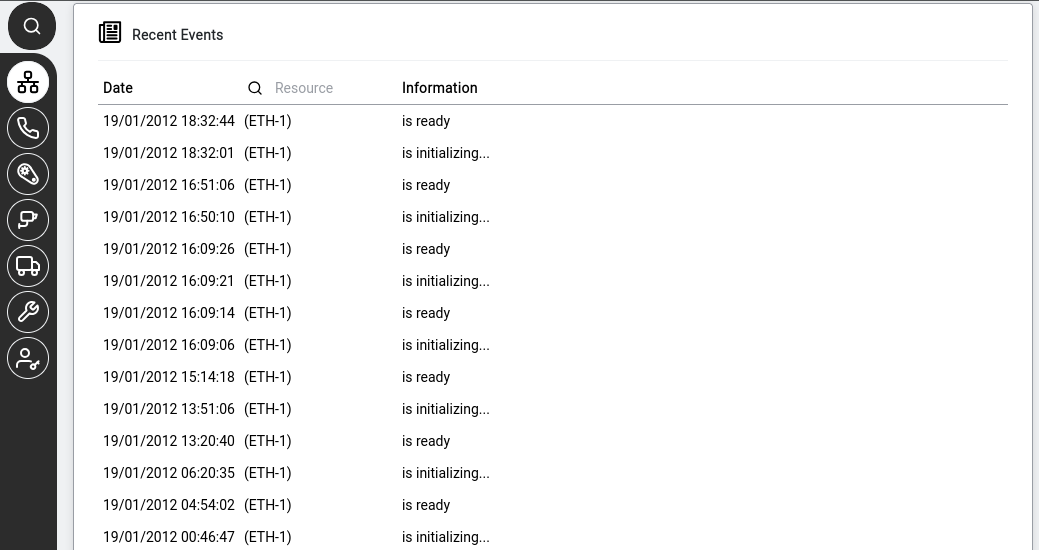
A chronological feed of the latest network status changes. Each row shows:
12/03/2026 14:22:11).(Eth-1)). Click the