Navigate to Tools > CPU Load.
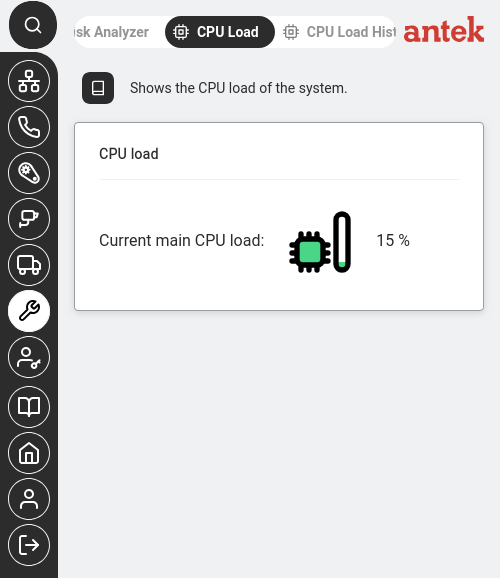
This page shows the current processor utilisation as a single percentage (0–100%) with a coloured bar indicator that fills proportionally. The reading refreshes on its own — reload the page or wait a moment to see it update. For a graph of usage over time (spotting spikes, daily patterns), switch to the CPU Load History sub-tab; see How-To: Monitor CPU load for the SNMP prerequisite that History needs.
| CPU Load | What It Means | Action Needed? |
|---|---|---|
| 0–30% | Normal. The unit is handling its workload comfortably. | No action needed. |
| 30–70% | Moderate load. The unit is busy but still has capacity. | Keep an eye on it during peak hours. |
| 70–90% | High load. The unit is working hard. You may notice slower Web Interface response times. | Investigate what's causing the load (many simultaneous calls, heavy video recording, large file transfers). |
| 90–100% sustained | Overloaded. The unit may drop calls, slow down camera streams or become unresponsive. | Reduce the load: stop non-essential services, reduce simultaneous camera recordings or limit active VPN tunnels. Check the Common Causes below to identify what is consuming resources. |