Navigate to Phone > Statistics. View call-traffic reports filtered by user, time period and call type. Save your filter combinations as presets so you can re-run the same report with one click later.
To create a preset, click the expand arrow on New Preset.
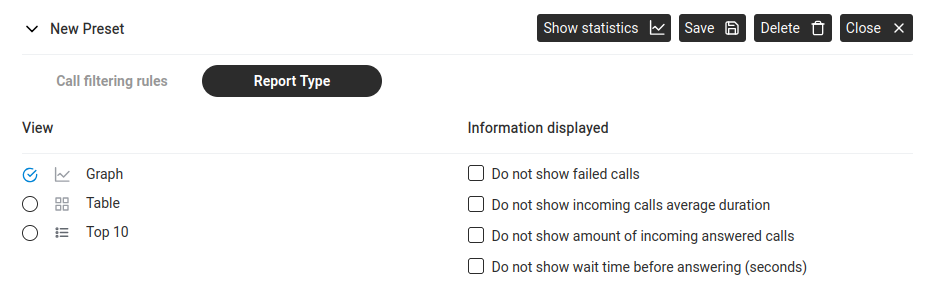
| View | Output |
|---|---|
| Graph | Visual chart. |
| Table | Data table with totals. |
| Top 10 | Busiest extensions/numbers. |
Information displayed checkboxes (right side):
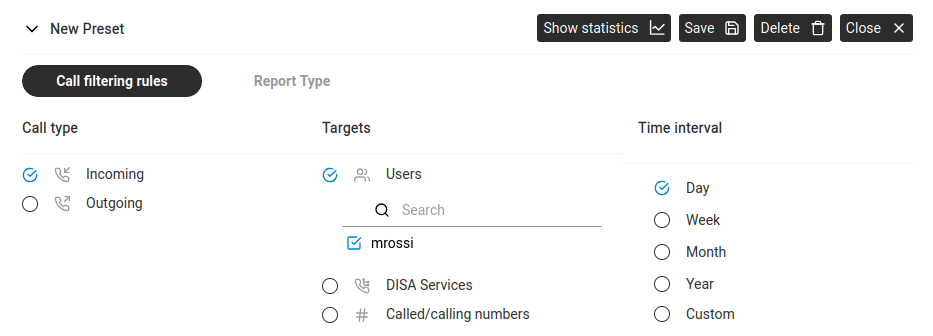
Buttons: Show statistics, Save, Delete, Close.
After clicking Show statistics, the results appear below the preset panel. The output depends on the selected Report Type:
In Graph view, the output shows a colour-coded legend at the top identifying each metric by user (e.g. "mrossi") and a time-based chart below. The legend includes:
| Metric | What It Measures |
|---|---|
| Number of incoming answered calls | How many incoming calls were picked up. |
| Number of incoming failed calls | Calls that could not connect (network error, busy, etc.). |
| Number of incoming busy calls | Calls rejected because the extension was busy. |
| Number of incoming abandoned calls | Calls where the caller hung up before being answered. |
| Wait time before answering (s) | Average seconds callers waited in the queue. |
| Incoming calls duration (s) | Average call length. |
| Wait time before abandoning (s) | How long callers waited before giving up. |
The Sampling interval (shown in blue, e.g. "5 minutes") determines the granularity of the graph. Shorter intervals give more detail but require more TRFA data.
Click Export to CSV to download the raw data as a spreadsheet-compatible file.